Showing posts with label DNA Analysis Organization. Show all posts

21 July 2018

DNA Simulation added to DNA Matrix in Progeny Charting Companion

Pierre Clouthier, president of Progeny Genealogy, has been raising the bar for DNA analysis charts in a genealogy program for the last year or so. He was the first to automate the "McGuire Chart" in his "DNA Matrix" tools. See http://debsdelvings.blogspot.com/2017/03/wanted-genetic-genealogy-analysis-tools.html and http://debsdelvings.blogspot.com/2017/06/one-dna-analysis-chart-process.html for more info.

Progeny just released Charting Companion version 7 with a major addition to help during DNA analysis as described in his announcement below (URLs were changed to go directly to the Progeny website and not to the advertising site in the email sent to me so as not to mess with stats from email accesses).

Charting Companion 7 features a new technology to help place adoptees and orphans in a family tree: the DNA Simulation. Based on the DNA Matrix, the DNA Simulation will construct a Descendant tree, then will systematically try to link the "orphan" to every person in the tree, one at a time. Charting Companion will validate the tree by calculating the expected centiMorgan (cM) implied by the hypothetical relationship, and comparing it to the actual laboratory DNA test results. Each iteration is called a "scenario". If the DNA test results are outside the cM range, the scenario is bad, will be discarded, and Charting Companion will advance to the next possible position of the orphan in the tree. If the DNA results are consistent, the good scenario will be recorded. All possible scenarios can then be reviewed for further investigation. (see video [at https://youtu.be/yBe6Pd8g5no]).


In addition to linking to existing persons, Charting Companion will also insert hypothetical or placeholder spouses and children, and attempt to link the orphan to these additional people. The added persons represent potential extramarital relationships, previous unknown marriages, unknown children, children given up to adoption, non-paternal events, etc. They are meant to suggest possible connections that would otherwise be very time-consuming to evaluate manually.

The DNA Simulation is available in Charting Companion 7. See video [at https://youtu.be/yBe6Pd8g5no] for detailed explanation.

If you have an earlier version of Charting Companion, our upgrade policy is:

If you purchased within the last year, you get a free upgrade (contact [Progeny]).
If you purchased within two years, you get a 20% discount (contact [Progeny]).
Within three years, purchase a Registration Key [at http://progenygenealogy.com/Products/Family-Tree-Charts].

Charting Companion works with all genealogy programs: Family Tree Maker, RootsMagic, Legacy, Ancestral Quest, Family Historian, GEDCOM, etc.

Progeny Genealogy
10037-20 Silver Fox Ave. New Minas, Nova Scotia B4N 5K1 Canada
(902) 681-3102


All statements made in this blog are the opinion of the post author. This blog is not sponsored by any entity other than Debbie Parker Wayne nor is it supported through free or reduced price access to items discussed unless so indicated in the blog post. Hot links to other sites are provided as a courtesy to the reader and are not an endorsement of the other entities except as clearly stated in the narrative.


To cite this blog post:
Debbie Parker Wayne, "DNA Simulation added to DNA Matrix in Progeny Charting Companion," Deb's Delvings, 21 July 2018 (http://debsdelvings.blogspot.com/ : accessed [date]).

© 2018, Debbie Parker Wayne, Certified Genealogist®, All Rights Reserved

16 September 2017

DNA Workshop, Southwest Tennessee, 28 October 2017

I have been invited to teach an all-day DNA seminar in a workshop format in Germantown, Tennessee, on 28 October 2017. This will include hands-on analysis of autosomal DNA segments and correlating the DNA and documentary evidence.


Gingerbread family recombination,
©2016, Debbie Parker Wayne

The original event space in Germantown sold out, but there are spaces available in the larger venue now reserved. This will be my last workshop this year (my other scheduled events have been cancelled due to damage caused by Hurricanes Harvey and Irma). I am looking forward to spending time in Germantown, Memphis, and southwest Tennessee. I hope to see many old friends there and make some new friends.

Registration is available at http://www.tngs.org/event-2556801.

Date: Saturday, 28 October 2017

Time: 8:00am to 3:00pm

Place: Germantown Church of Christ, 8723 Poplar Pike, Germantown, TN 38138

Sessions include
  1. DNA and Genetic Genealogy Today: A brief review of DNA inheritance and basic genetic information, company tools, and third-party tools
  2. Y-DNA and mtDNA Analysis: Match list analysis, project advantages, using Y-DNA and mtDNA to prove Native American ancestry and to link to a common ancestor through DNA matches
  3. Autosomal DNA (atDNA) Analysis: Match list analysis, shared surname, and family tree analysis; genetic networks: shared matches, In Common With (ICW), DNA Circles; and triangulated groups
  4. Correlating DNA and Documentary Evidence: Apply DNA and documentary evidence to answer genealogical relationship questions
A family tree and documents will be used for hands-on activities to confirm (or refute) links in a tree, determine if a newly found DNA match belongs in the same tree, and whether documentary evidence correlates with the DNA evidence to support or disprove a hypothesis.


My Family Chromosome Map: Kitty Cooper Chromosome Mapper,
©2017, Debbie Parker Wayne


My Family Y-DNA Correlation, ©2017, Debbie Parker Wayne


To cite this blog post: Debbie Parker Wayne, "DNA Workshop, Southwest Tennessee, 28 October 2017," Deb's Delvings, 16 September 2017 (http://debsdelvings.blogspot.com/ : accessed [date]).

© 2017, Debbie Parker Wayne, Certified Genealogist®, All Rights Reserved

25 August 2017

Free (for some) atDNA Analysis Workshop


Genetic Genealogy, using DNA to answer genealogical questions, is one of the hottest topics in genealogy today. Every professional researcher, really every researcher of any kind, needs a basic understanding of using the different DNA tests available, analysis tools, and writing about DNA analysis to incorporate it into research reports or essays. Researchers must understand how to correlate DNA evidence with documentary evidence to analyze a genealogical question, and they also must understand how to present DNA evidence in a format understandable by novices as one of the elements supporting a conclusion. A hands-on workshop helps understand the necessary skills.

Lone Star Chapter of APG is sponsoring a four-hour Autosomal (atDNA) Analysis Workshop at the upcoming 2017 TxSGS Family History Conference. Attendance will be free to all Lone Star Chapter of APG members. Non-members of the chapter must pay a registration fee ($50) to attend this limited-space workshop. The workshop will be on Saturday afternoon, 21 October 2017. The current schedule lists a 1:30pm start time, but the start time may change to 1:00pm. Check your conference schedule once you arrive.

This workshop is for researchers with high-beginner to intermediate level DNA knowledge and professional genealogists adding DNA clients. Topics covered in the workshop include a brief review of DNA inheritance and analysis tools for the match list, family trees, and DNA test results. A case study will illustrate DNA analysis, applying documentary and genetic evidence, and writing and reporting the results.


Lone Star Chapter members, or those who wish to renew or join the chapter to get this member benefit, should contact Treasurer Michael Belcher at mikeandvickib@mac.com. Michael can supply you with the code to enter during conference registration to get free registration for this four-hour workshop and he can assist with joining the chapter if you are not already a member. You must first be an APG member before joining the Lone Star Chapter.
(Note: the chapter website was not available at the time this blog was written.)

Conference and workshop registration is through the TxSGS website at http://www.txsgs.org/conference/registration/. Do not forget to enter the workshop code (obtained from Michael Belcher) or you will be charged for the workshop registration.

This workshop is presented by me. For those who may not know my background, I am co-author (with Blaine T. Bettinger) of the popular, first-ever genetic genealogy workbook, Genetic Genealogy in Practice, published by the National Genealogical Society (NGS); author of the online, self-paced course Continuing Genealogical Studies: Autosomal DNA, offered by NGS; coordinator of the first DNA courses presented at all four of the major genealogy institutes (GRIP, SLIG, IGHR, CAFG FGI); and the DNA Project Chair for the Texas State Genealogical Society and the Early Texans DNA Project. Other publications include a column on using DNA analysis for genealogical research in NGS Magazine from 2013 to the present, many DNA articles in TxSGS journal Stirpes, articles in the APG Quarterly, and other regional journals. More information and archived versions of many of these articles can be found at http://debbiewayne.com/pubs.php.


The Texas State conference is one of the biggest annual conferences in the area with many fine speakers known nationally, regionally, and locally. Check out all of the other informative sessions available from conference headliners J. Mark Lowe, CG, and Dr. Michael Lacopo as well as the many sessions presented by Deborah A. Abbott, PhD; Susan Ball; Andrew Carroll; Henrietta Martinez Christmas; Deena Coutant; Schelly Talalay Dardashti; Patti Todd Gillespie; Sara Gredler; Colleen (Robledo) Greene; Tony Hanson; Susan Kaufman; Andrew Lee; Devon Noel Lee; Janice Lovelace; Bernard Meisner; Kelvin L. Meyers; Betsy Mills; Jeannette Piecznski; Diane Richard; Mary Kircher Roddy; Michael L. Strauss, AG; Cari Taplin, CG; Lisa Toth Salinas; Angela Walton-Raji; and Eric Wells.

We hope to see you all there at this must-see event in Texas, 20–22 October 2017 in Katy (just west of Houston).


To cite this blog post: Debbie Parker Wayne, "Free (for some) atDNA Analysis Workshop," Deb's Delvings, 25 August 2017 (http://debsdelvings.blogspot.com/ : accessed [date]). © 2017,
Debbie Parker Wayne, Certified Genealogist®, All Rights Reserved

The words Certified Genealogist are a registered certification mark, and the designations CG, CGL and Certified Genealogical Lecturer are service marks of the Board for Certification of Genealogists®, used under license by board certificants after periodic evaluation.

The ICAPGenSM service mark and the Accredited Genealogist® and AG® registered marks are the sole property of the International Commission for the Accreditation of Professional Genealogists. All Rights Reserved.

01 July 2017

DNA Data Org Tip: Associate Kit with Name for Downloaded Data

This is a small tip but a great time and frustration saver for anyone who has tested a lot of family members at Family Tree DNA or who uses aliases instead of real names for test-takers at any DNA testing company.

This tip helps me import data into the correct Genome Mate Pro profile. It also helps me ensure that I am analyzing the correct person's data when I am using other tools such as Double Match Triangulator by Louis Kesslerr or David Pike's atDNA Tools. Before I started using this method I had to keep a cheat sheet handy correlating DNA kit numbers with the alias name on the account and the real name of the test-taker.

In order to keep up with new DNA matches we must periodically download the new match list and associated data. For Family Tree DNA I use the DNAgedcom Client to download match lists, chromosome segment comparisons, and In Common With (ICW) data.

Downloaded DNA results for from FTDNA include the kit number and content description, as in 12345_Family_Finder_Matches.csv, 12345_ChromosomeBrowser.csv, and 12345_ICW.csv (where 12345 is the kit number).


When you have all three files for twenty or more family members it can be difficult to find the files for one family member unless you keep a cross reference for kit number and name. For those of us with dozens of family members tested, I came up with a trick to save time in identifying downloaded results and which family member they belong to. I no longer have to keep my cross reference list handy.

I made a folder where I have one empty file for each family member. The file name is what is important, not the contents. The file is named 12345__ALIAS_realname.csv (where 12345 is the kit number, ALIAS is the account name for the kit, and realname is the name I know that person by).


Any time I download DNA test results to a new folder I can copy my empty files into the download folder. The file names sort so that my empty file identifying the person associated with a kit number allows me to easily identify whose data files I am looking at.


These screenshots are from one of my favorite programs, FreeCommander, a great Windows file manager replacement with many features that I love. I use FreeCommander much more than I use Windows Explorer.


To cite this blog post:
Debbie Parker Wayne, "DNA Data Org Tip: Associate Kit with Name for Downloaded Data," Deb's Delvings, 1 July 2017 (http://debsdelvings.blogspot.com/ : accessed [date]).

I have no interest in any of the companies or tools mentioned here except as a satisfied user and/or customer.

© 2017, Debbie Parker Wayne, Certified Genealogist®, All Rights Reserved

30 June 2017

One DNA Analysis Chart Process

Edited 13 July 2017 to add MS Word Smart Art tip from David Williams.

I presented a webinar last month on correlating DNA and documentary evidence using the Genealogical Proof Standard (GPS). The webinar was sponsored by BCG and presented by Legacy Family Tree Webinars.

Several viewers contacted me asking how I created the charts I used in the webinar.

Over the last few years I have tried multiple methods. I wrote about some different methods I have used and asked researchers to send me your feature wish list back in March ("Wanted: Genetic Genealogy Analysis Tools Incorporating Family Tree Charts"). I am still collecting ideas for all types of features genetic genealogists would like added to software programs to assist in DNA analysis. Please email your wish list to debbieparkerwayne at gmail dot com or add a comment to this blog post or the "Wanted ..." blog post.

The family tree charts in the webinar were made with Smart Art in Microsoft (MS) Word where I customized the colors and effects on the boxes. A template for the charts is online at http://debbiewayne.com/presentations/dna/MSWord_smartart_chart_black.docx.

I sometimes use TreeDraw (http://treedraw.spansoft.org/), Progeny Charting Companion (https://progenygenealogy.com/products/family-tree-charts.aspx), and RootsMagic, as well as Microsoft Smart Art to create the charts. Lucid Chart (https://www.lucidchart.com/) is used by some of my colleagues. It has some features you have to pay to access and it is a web-based tool.

Until one of the genealogy or charting programs or third-party utilities automates the process I have settled on the following procedure to create my charts for DNA analysis.

  1. I create a descendant chart (using one of the tools named above) with only the lineages of the DNA test-takers under analysis. When using MS Smart Art I add one extra block at the bottom of each line because, for some silly reason, Word offsets the last block.

    Tip from David Williams added 13 July 2017: Instead of adding an extra block, click on the "Design" ribbon, click on the parent block for the offset block, click on "Layout" in the "Create Graphic" section of the ribbon, select "Standard." This relocates the last block in a straight line with the others. Thanks, David, for sharing this Word tip.

    I found you can also use control/click to select all of the parent blocks before clicking "Layout> Standard" and fix all lines at one time. Also, if you do not see the "Layout" drop-down menu in the "Create Graphics" section of the ribbon, it may be because Word replaces the words with icons when the window is too narrow to display all of the words spelled out. Make your Word window wider or move your mouse over the image of a chart in the "Create Graphics" section and then you should see a popup indicating this is the link to "Organizational Chart Layout." The template has been modified to fix this layout issue. There is no need to add an additional block any longer.


  2. Once I have the chart I want, I grab a screen-shot and save it as an image. I use Snagit by TechSmith, but there are other options including built-in operating system snipping tools.

  3. I then insert that chart image into my image editor (I use Snagit editor) (where I used to remove that offset block, but no longer need to now). I may also fill in background colors or make other changes to the image, sometimes coloring in the block for my focus person.

  4. I insert the modified image into a Word document and enlarge it to fill the page leaving a margin on both left and right.

  5. I create a MS Word table under the image. The table has two columns more than the number of lines in my descendant chart. I then either manually size each table column or use the table properties to have Word automatically size the columns so that each table column lines up under a family line in my chart. The two extra columns are to the left and right. I insert the names of the test-takers into the left column, right column, and the top row of the table so I have a matrix to indicate how all of the test-takers compare to each other.

  6. The document can be printed to allow penciling in of relationships and total amount of shared atDNA,
    atDNA chromosome match segment data (chromosome number, start, end, length in cM),
    Y-DNA STR values,
    or whatever is being analyzed.

  7. Once I am satisfied with my numbers then I enter them into the table in Word and save the document.

For detailed analysis, I use the full chromosome segment start and end values as given by the testing company. In the webinar and the images above I shortened the numbers by using K to represent thousands and M to represent millions. This is to allow more data to fit onto the image for a Powerpoint slide.

The process is more complex to describe than it is to do.

Some genealogists like Excel charting. If you do, you might be interested in the McGuire charting method. See http://thegeneticgenealogist.com/2017/03/19/guest-post-the-mcguire-method-simplified-visual-dna-comparisons/. I find Excel's drawing tools more difficult to use than Word, and even Word is not intuitive or easy.

There are many online help sites with info on how to use Microsoft Smart Art. When I want to do something new I usually just try Google and can generally find step-by-step instructions.


To cite this blog post:
Debbie Parker Wayne, "One DNA Analysis Chart Process," Deb's Delvings, 30 June 2017, updated 13 July 2017 (http://debsdelvings.blogspot.com/ : accessed [date]).

© 2017, Debbie Parker Wayne, Certified Genealogist®, All Rights Reserved

21 March 2017

Wanted: Genetic Genealogy Analysis Tools Incorporating Family Tree Charts

Programmers who are interested in genetic genealogy have provided some great tools for DNA analysis. Testing companies provide some great tools, too. New tools are produced all of the time and I use and love most of them. I WANT MORE. I want some specific features. Few of these tools today correlate the detailed DNA data (Y-DNA STR mutations, atDNA shared segments with start and stop points on a chromosome) with the family tree in an easily understood way. That correlation is essential for the "genealogy" in genetic genealogy.

One of the to-do tasks that keeps getting shoved lower on my priority list is to provide genealogy software developers with a list of what we need to incorporate DNA data into our databases and to create useful output for analysis. Genetic genealogical research has matured to the point where this should become a priority.

If we all pool our ideas, we can come up with a good list to provide to developers so the output is what we want. We need a list of the data we want to store in the genealogy database as well as what type of output reports we need.

So what would your ideal genealogy database incorporate and provide as output for your genetic analysis? Not necessarily the raw DNA data for analysis, but the shared DNA data related to the other test-takers in your database.

Feel free to provide suggestions as comments to this blog post, as Facebook comments if you read this on Facebook, or contact me directly using the email addresses on my website http://debbiewayne.com/ (scroll to the bottom of any page to see contact info).

So what finally spurred me to make this a priority after all this time? (1) I investigated different tree creation tools a few months ago and discussed it on Facebook. I found none of the tools produce exactly what I want for DNA analysis. (2) The McGuire Method of charting several of us saw last summer was published.


Lauren McGuire recently wrote a guest post on Blaine T. Bettinger's The Genetic Genealogist blog, "GUEST POST: The McGuire Method – Simplified Visual DNA Comparisons." This describes the great chart she designed for correlating a family tree and shared autosomal DNA (atDNA) totals for analysis. The chart Lauren uses in the blog post displays total shared centimorgans (cM), percentage shared, and relationship of each person on the tree in an efficient and compact format. I like seeing all of these items at once as all are important during analysis.

I immediately loved Lauren's chart when I first saw it. She and I obviously think the same way about what we want to see when analyzing DNA information.

My own charts started out with printed trees - either created in an image editor, Microsoft Word SmartArt, RootsMagic genealogy software, Progeny Charting Companion, or, more recently TreeDraw. Lauren and many others use Excel. Some use LucidChart and other online charting tools (find more info on these tools with a Google search). None of these tools provide an easy way to create a tree that only includes the DNA test-takers, much less incorporate the DNA data with the tree. And often my DNA data is handwritten at the bottom of the printed chart. If I want to make it look prettier then I spend a lot of time getting a Word table to line up under the family tree.

My own charts have evolved over the years. I started by creating an image of the tree and Y-DNA STR differences in an image editor:

Y-DNA and Tree Chart as Image, Debbie Parker Wayne

That evolved into a Word table that was easier to modify:


Y-DNA and Tree Chart as Table, Debbie Parker Wayne

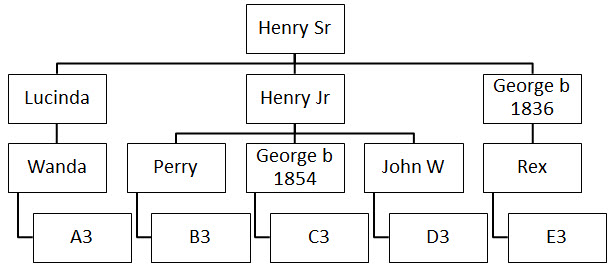
Then into Word SmartArt which was better to show in a presentation:

Y-DNA and Tree Chart as Smart Art, Debbie Parker Wayne

For autosomal DNA triangulation I started with Word SmartArt and hand-written shared segment info:


atDNA and Tree Chart as Smart Art with Hand-written Notes, Debbie Parker Wayne

That evolved into simplified trees with a Word table showing shared segment info:


atDNA and Tree Chart as Smart Art with Shared Segment Table, Debbie Parker Wayne

I use a similar table when I am analyzing total shared DNA against the tree relationships.

What other formats have you found useful? What would make your DNA analysis process easier?

In my opinion, tree charts are most useful when each test-taker's lineage is shown in a column and each generation is contained in a row. The DNA data for a test-taker can be shown below in the same column as the lineage. The rows allow for easy calculation of relationships - which the software could do for us and include in the chart.

A chart including only the people in the DNA study is essential. I have been creating additional RootsMagic databases including only the DNA test-takers and their ancestors, but this takes a lot of time. The pared down database is input to one of the charting programs, but I still sometimes have to remove spouse boxes when I am only interested in the men for a Y-DNA study, for example. Creating a chart from my full database and then deleting the people I do not want takes even longer.

The DNA data to incorporate into our genealogy database varies for Y-DNA, autosomal and X-DNA, and mitochondrial DNA. Autosomal DNA analysis requires total shared DNA or shared segment information. Y-DNA analysis requires notation of differing Y-DNA STR and SNP markers. Mitochondrial DNA requires listing the locations that differ from a reference sequence and/or between test-takers. For Y-DNA and mtDNA we may want to include haplogroups. Even though we all know the admixture estimates vary depending on the reference population and algorithm used, we might want to record the estimates and which portions of which chromosomes match which reference populations.

Send me your ideas and I will compile a list we can prioritize and provide to the genealogy software developers. This new list will not be specific to any testing company or software, but a list of data we want to track in our DNA analysis and provide in reports we use for our analysis and publications. There may some overlap between the list I compile and the ISOGG Wiki wish lists for the testing companies:
https://isogg.org/wiki/FTDNA_wish_list,
https://isogg.org/wiki/23andMe_wish_list,
https://isogg.org/wiki/AncestryDNA_wish_list, and
https://isogg.org/wiki/MyHeritage_wish_list.

If you are on Facebook, these discussions relate to this issue although you may not be able to see the posts depending on Facebook settings
https://www.facebook.com/debbie.p.wayne/posts/10212404574018709
https://www.facebook.com/groups/DNADetectives/permalink/1389234674480979/


March 21: Added a cropped portion of the McGuire chart with permission of creator, Lauren McGuire.

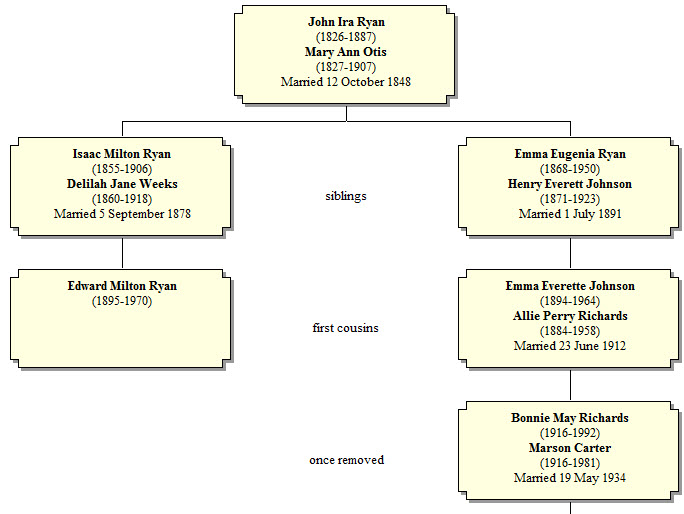
March 22: Image added to illustrate reply below to nut4nature22 dated March, 2017 05:43:

RootsMagic Relationship Chart Sample, Debbie Parker Wayne


To cite this blog post: Debbie Parker Wayne, "Wanted: Genetic Genealogy Analysis Tools Incorporating Family Tree Charts," Deb's Delvings, 21 March 2017 (http://debsdelvings.blogspot.com/ : accessed [date]).

© 2017, Debbie Parker Wayne, Certified Genealogist®, All Rights Reserved